Plotting ECG data with Arduino UNO and Sparkfun AD8232 Sensor.
Recently I have taken an interest in bio-electric signalling. My ultimate goal is building a custom EEG circuit, such as OpenBCI project. To study the basics, I have bought a single-lead ECG sensor AD8232. In this article, I describe how to connect this sensor to the Arduino UNO, read the data via serial port, and plot the signal in real-time using matplotlib.
Hardware Setup
Let’s take a look at the sensor board. Out of the box, the board did not have any pins on it. The first thing I did was soldering some male 2.54mm pins to connect to Arduino/breadboard using jumper wires. I don’t have much experience with soldering, but I think it went well this time.
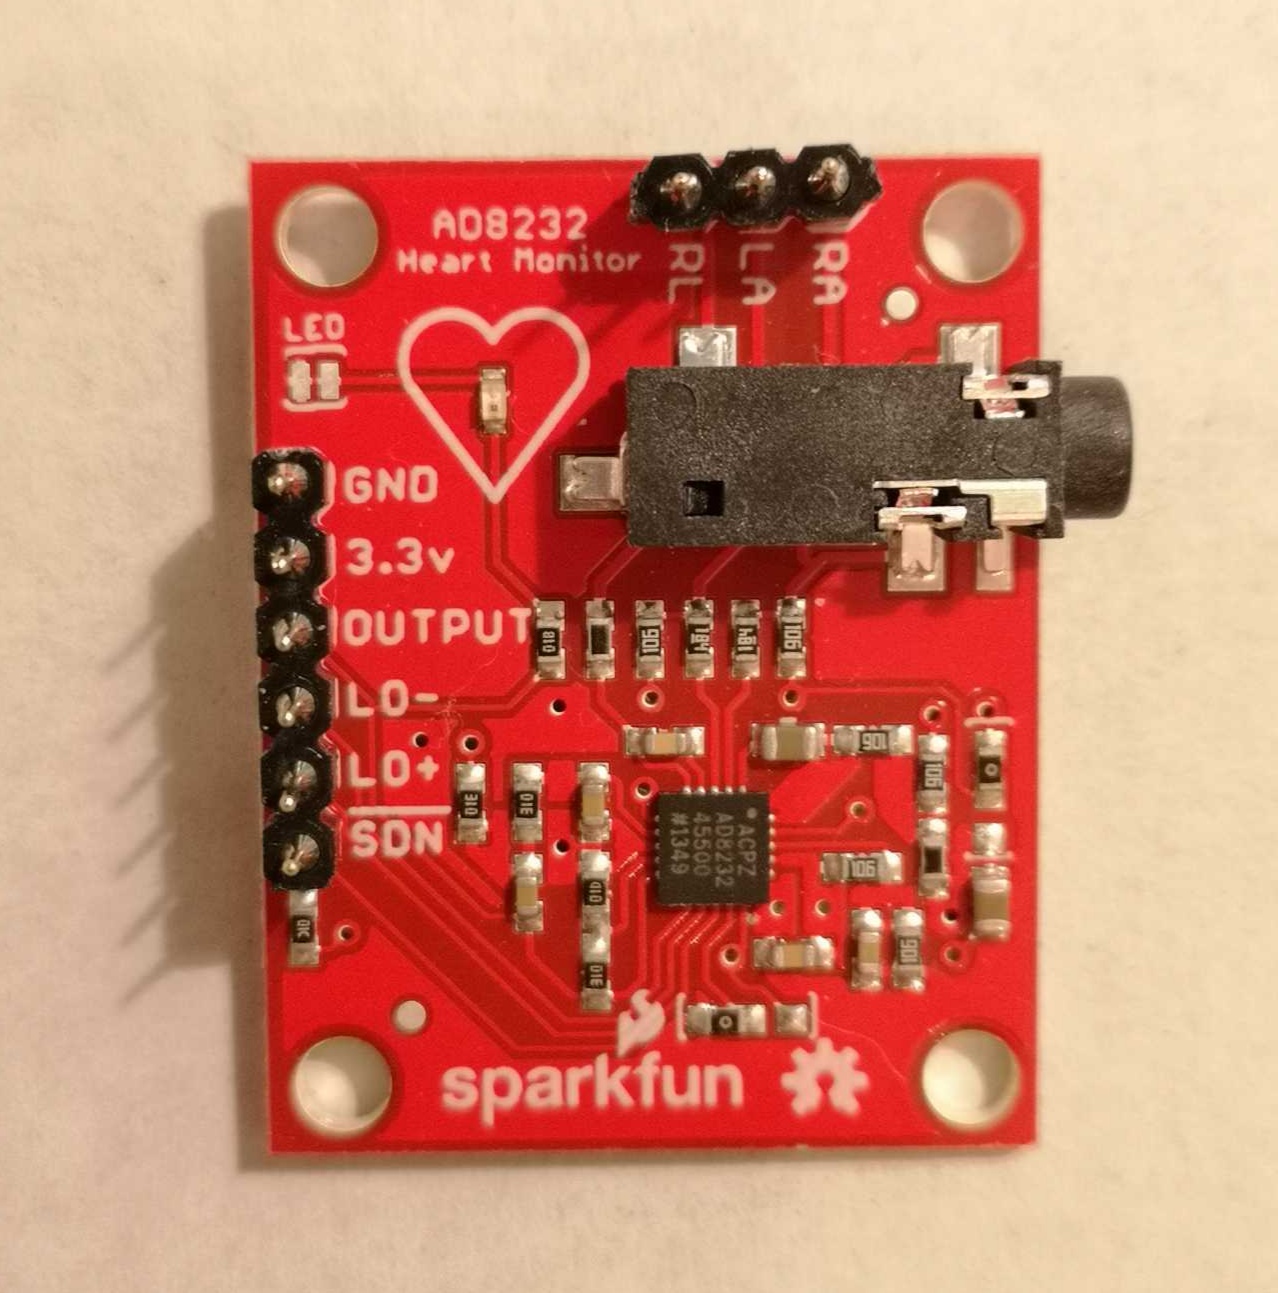
The sensor board interface consists of a 3.5mm audio jack socket to connect the electrodes, one red LED, which is a simple indicator of the ECG signal, and 9 connectors marked GND, 3.3V, OUTPUT, LO-, LO+, SDN, RA, LA, RL. The first 3 pins (GND and 3.3V for the power supply and OUTPUT to read the ECG signal) are the most important ones. All other connections are optional and their description can be found in the sensor manual.
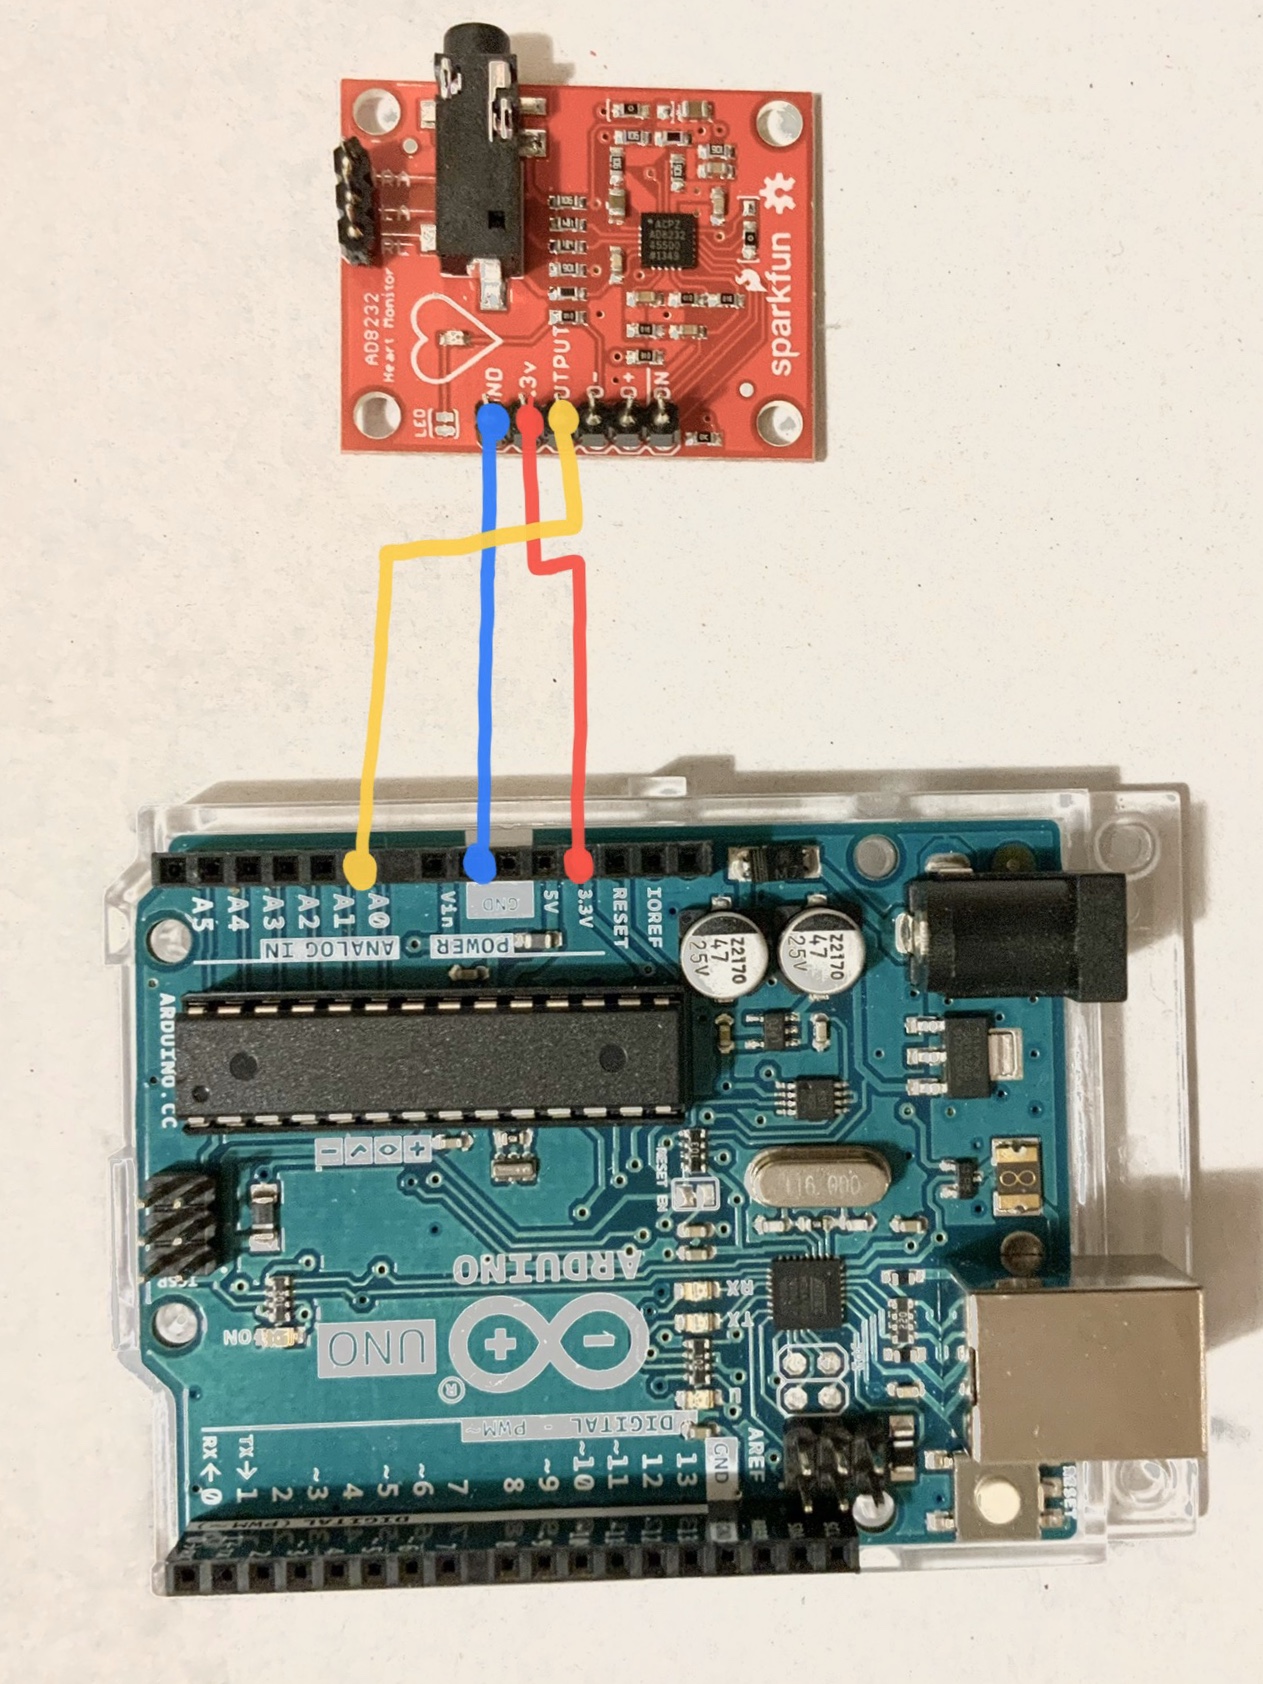
Reading the signal requires connecting sensor output to one of the Arduino’s analog inputs. To power the sensor, I used a 3.3V output from the Arduino. Here’s the connection diagram:
At this point, eager to see some results, I connected my oscilloscope to the sensor output, attached the electrodes (two on my chest and one on my hip), and turned on the power. The results were surprisingly good when I was steady, but even the smallest movement generated substantial noise from muscles activity.
Arduino Code
The simplest way to connect Arduino to a computer is with a USB cable, opening a serial port (on my MacBook, the port file was at /dev/tty.usbmodem14201). Let’s start with a simple Arduino code to write the data to the serial port.
void setup() {
    Serial.begin(9600);
    pinMode(A0, INPUT);
}

void loop() {
    int sample = analogRead(A0);
    Serial.write((char*)&sample, sizeof(int));
}
The setup function configures the serial port bitrate and sets the A0 (or whatever analog input is used to read the signal) to INPUT mode. In the main loop, we read a signal sample with analogRead() function. It returns a single integer in range <0; 1023>, which is proportional to the signal’s amplitude. Finally, the Arduino program concludes by writing the signal sample to the serial port.
Signal Viewer
I used pyserial package to read the data from the serial port, and matplotlib to plot the data in real-time.
import serial
from matplotlib import pyplot, animation

WINDOW = 1600
NSAMPLES = 80
REFRESH = 80

port = serial.Serial("/dev/tty.usbmodem14201", 9600)
figure = pyplot.figure()
subplot = figure.add_subplot(1, 1, 1)
data = [0] * WINDOW

def draw(i, data):
    data.extend([
        int.from_bytes(port.read(2), byteorder='little', signed=True)
        for i in range(NSAMPLES)
    ])
    subplot.clear()
    subplot.plot(data[-WINDOW:])

ani = animation.FuncAnimation(figure, draw, fargs=(data,), interval=REFRESH)
pyplot.show()
The matplotlib.animation module provides functions to modify plot data in real-time, using a callback. Matplotlib is repeatedly calling the draw() method every INTERVAL milliseconds. Each time, the script reads NSAMPLES values from the serial port and appends them to the collected data array. Eventually, it takes the latest WINDOW entries (plot width) and replaces the current plot with new data.

Full source code is available at my github. I’m waiting for a Bluetooth sensor, which I ordered this week to arrive to make this setup wireless. I think this is a good entry point to learning about bio-electric signaling. Having a reliable sensor might prove useful when experimenting with different electrodes. Next time I am going to make a DIY version of this ECG sensor.