Streaming EEG Data from Muse Direct
The idea of Brain-Computer Interfaces (BCI) has been wandering in my head for quite some time now. Recently an opportunity appeared for me to look more closely on the subject. I’ve decided to do my BEng thesis about the analysis of the EEG signal.
I started looking into available consumer-grade EEG devices. I considered Open BCI, Emotive EPOC+, and Muse 2. Eventually, I decided to go with Muse 2. The information I found online indicated it has the best signal quality. EPOC+ has more electrodes, however for over 2x the price of the Muse 2, I decided it is not worth it.
One important issue I missed before ordering the Muse device was the API. A quick google indicated there was one, so I did not investigate this any further. It turns out that Interaxon (the company behind Muse) no longer supports the official API.
From a BCI developer point of view, this is pretty much a deal-breaker. Fortunately, it is still possible to access the data programmatically, so buying the device wasn’t a complete waste of money. Figuring it out wasn’t easy for me, so I decided to share what I’ve learned in this post.
The data can be accessed programmatically with the use of OpenSound Control (OSC) protocol. Interaxon provides an application called Muse Direct (IOS only with 4$/month subscription). It can stream the Muse data using the OSC protocol over the network. One can then connect to this stream and receive the data.
After setting up the stream, any OSC-compatible UDP server can receive them. There are two ways to do this. The more interesting one is by implementing a custom OSC server. I am going to describe this in the next post. For now, let us use Muse Lab application to test that the streaming is working. Firstly, we need to download and configure the Muse Direct app on an iOS device.
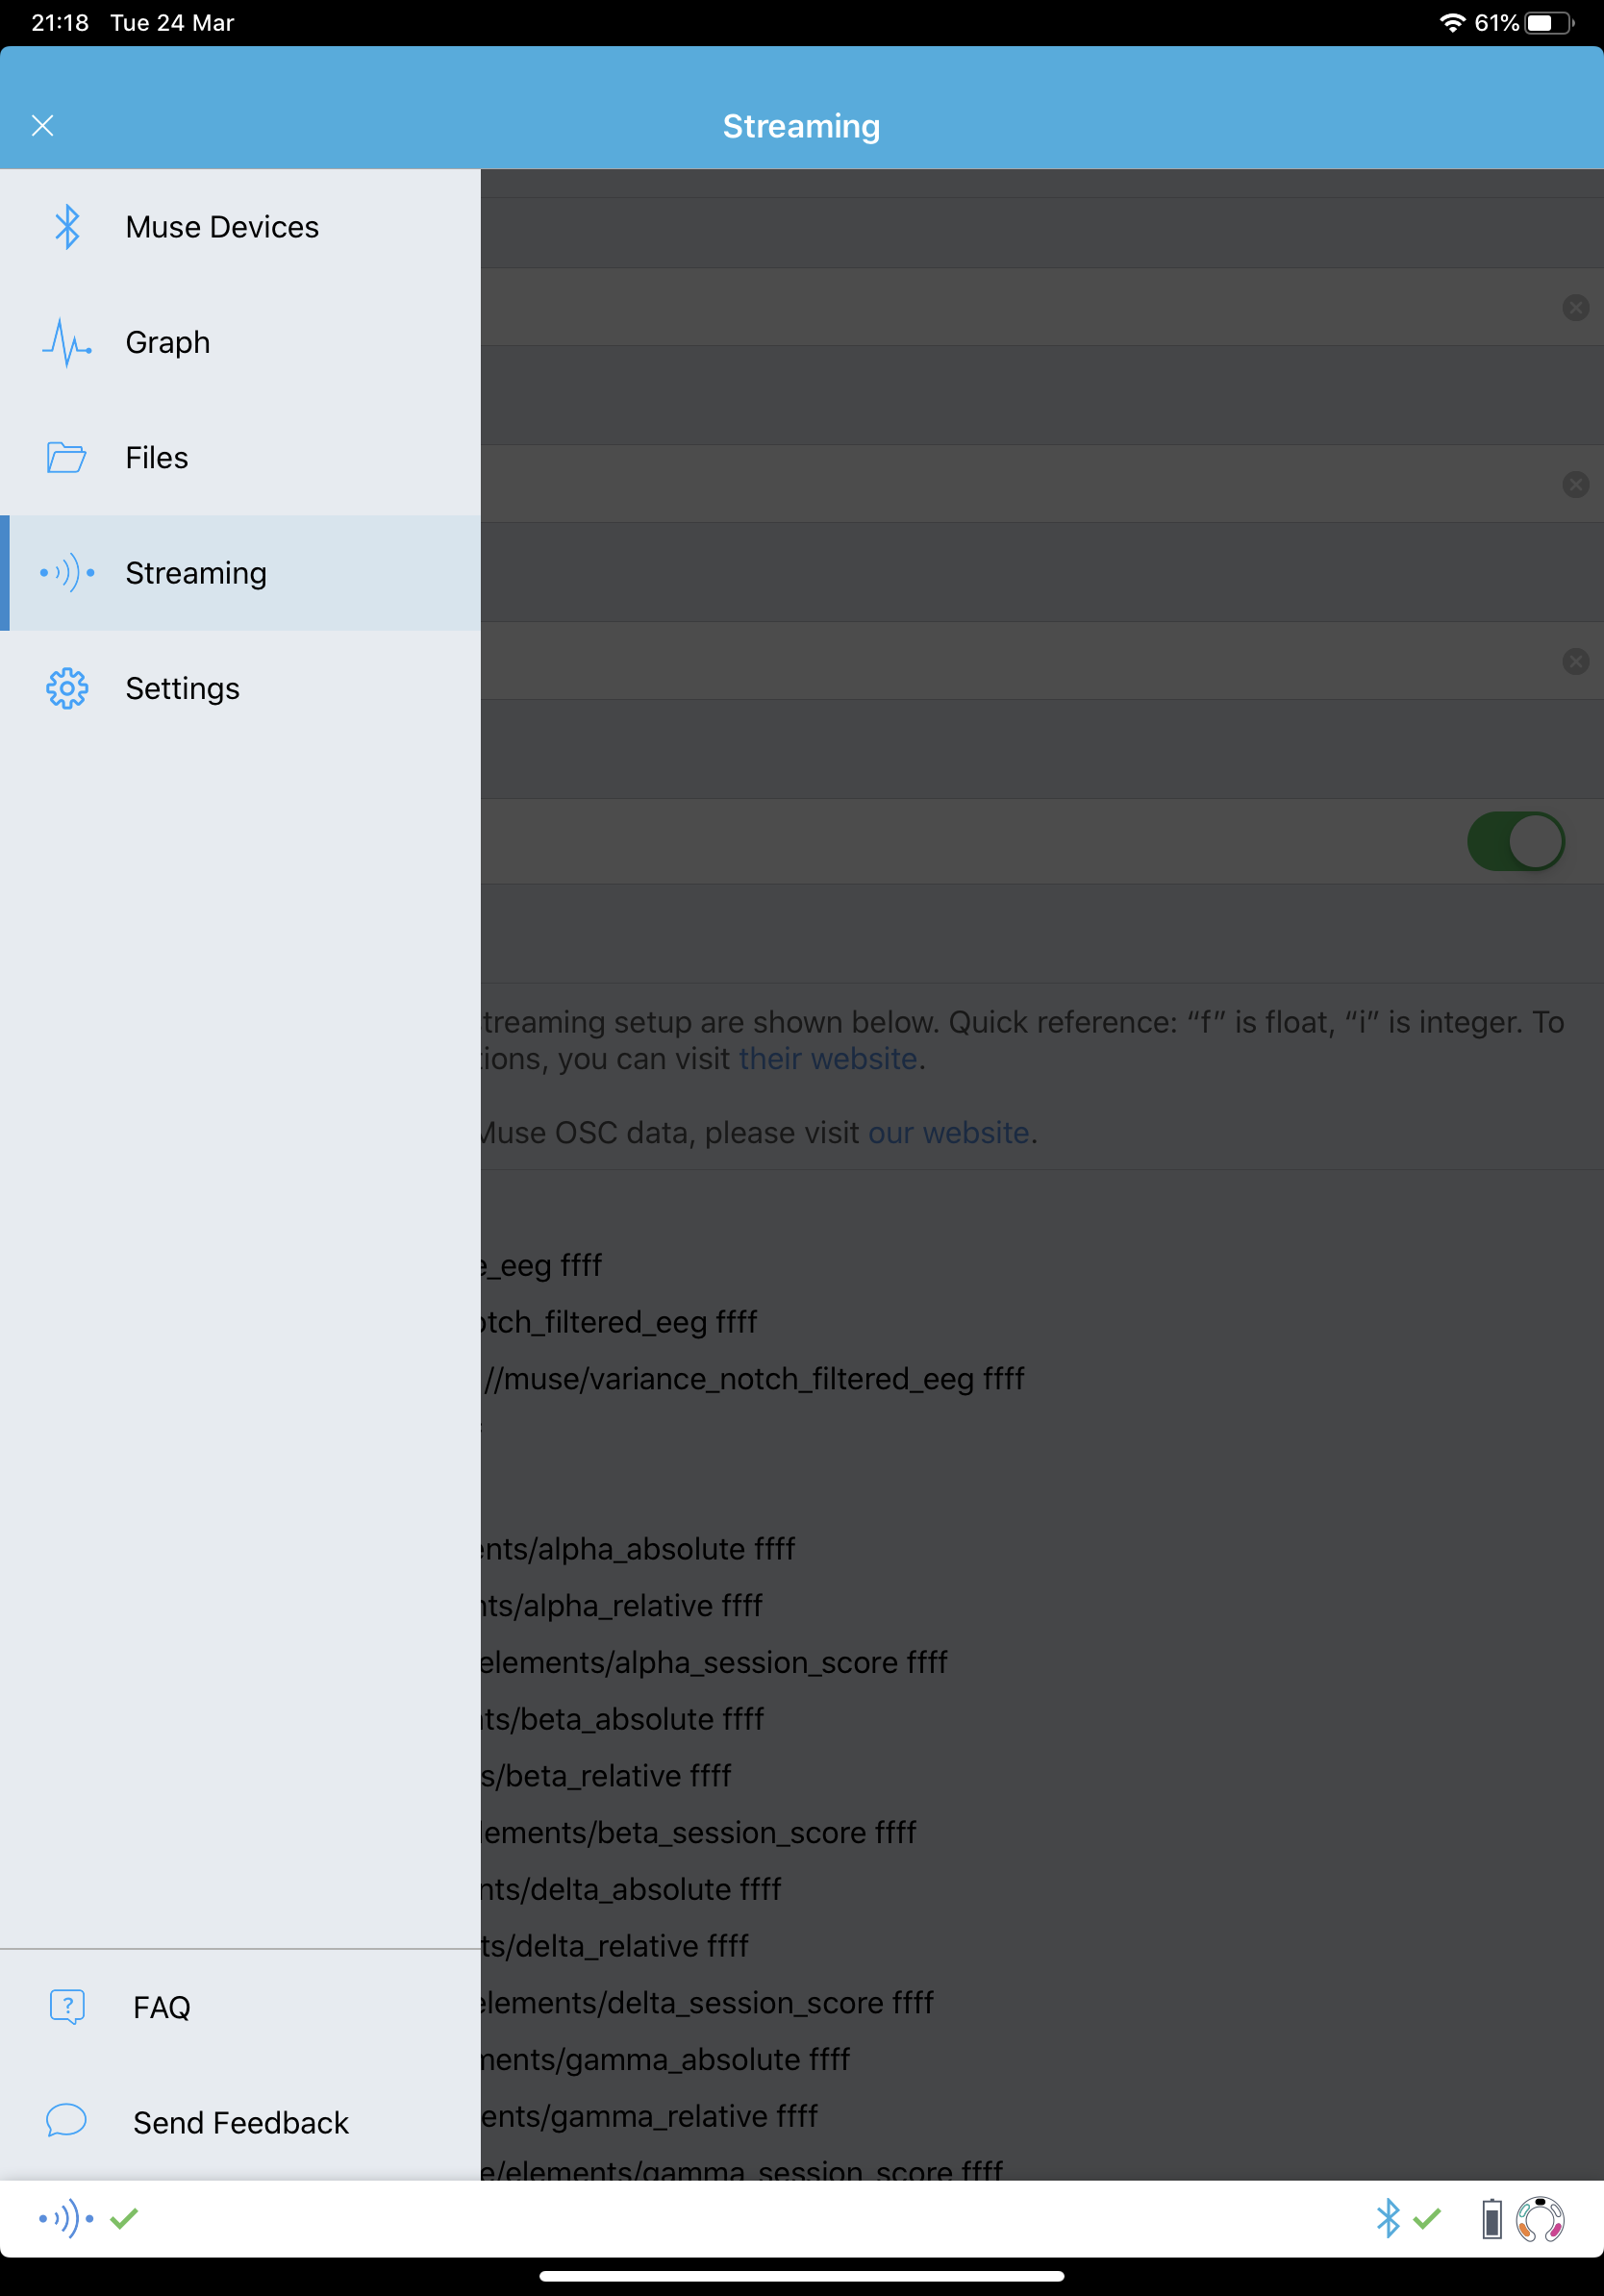
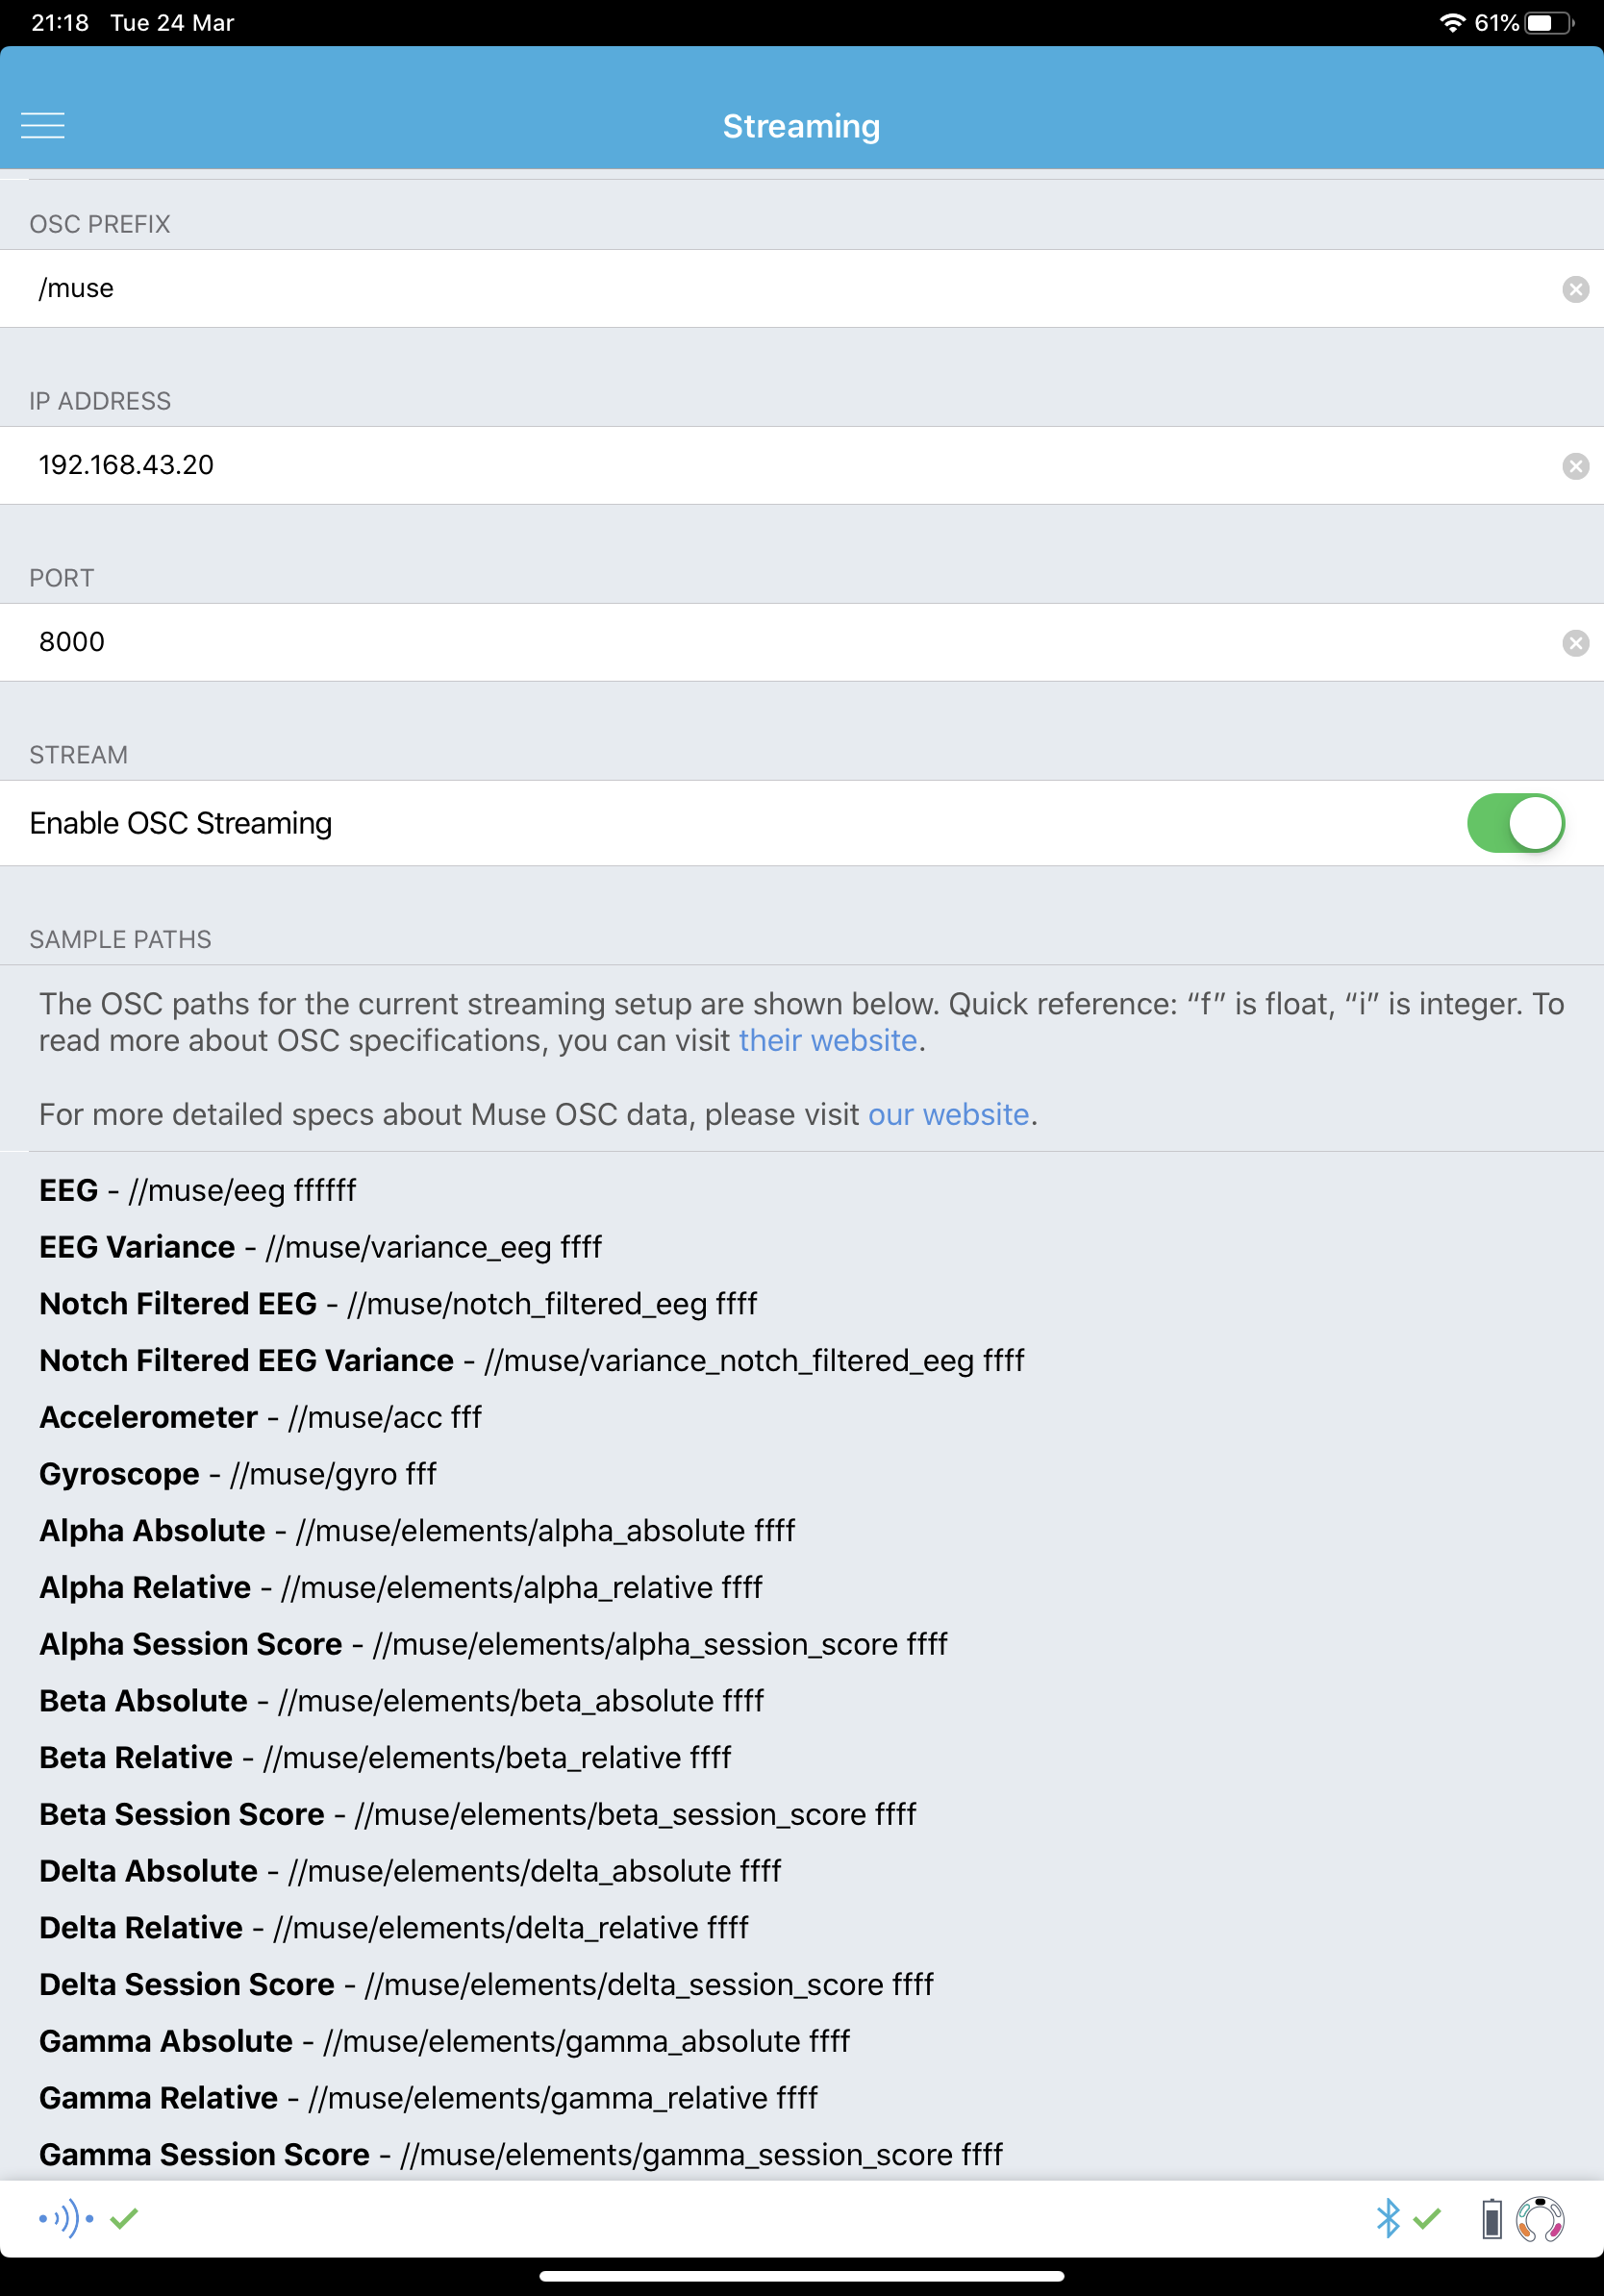
In the Muse Direct menu, select the Streaming tab to open the streaming configuration panel. First, switch Enable OSC Streaming to the yes position. Next, type in the IP address of the computer with the OSC server (in this case Muse Lab). You can leave the default port number (7000) or choose a different one, as long as it is open (I chose 8000). The settings should look similar to the following screenshot.
Next, we need to download and install Muse Lab on the computer. Download Muse SDK for the proper platform and install it. Muse SDK is no longer supported, fortunately the Muse Lab application still works correctly (at least on my Windows 10 laptop). After running the Muse Lab application, you should see the following window.
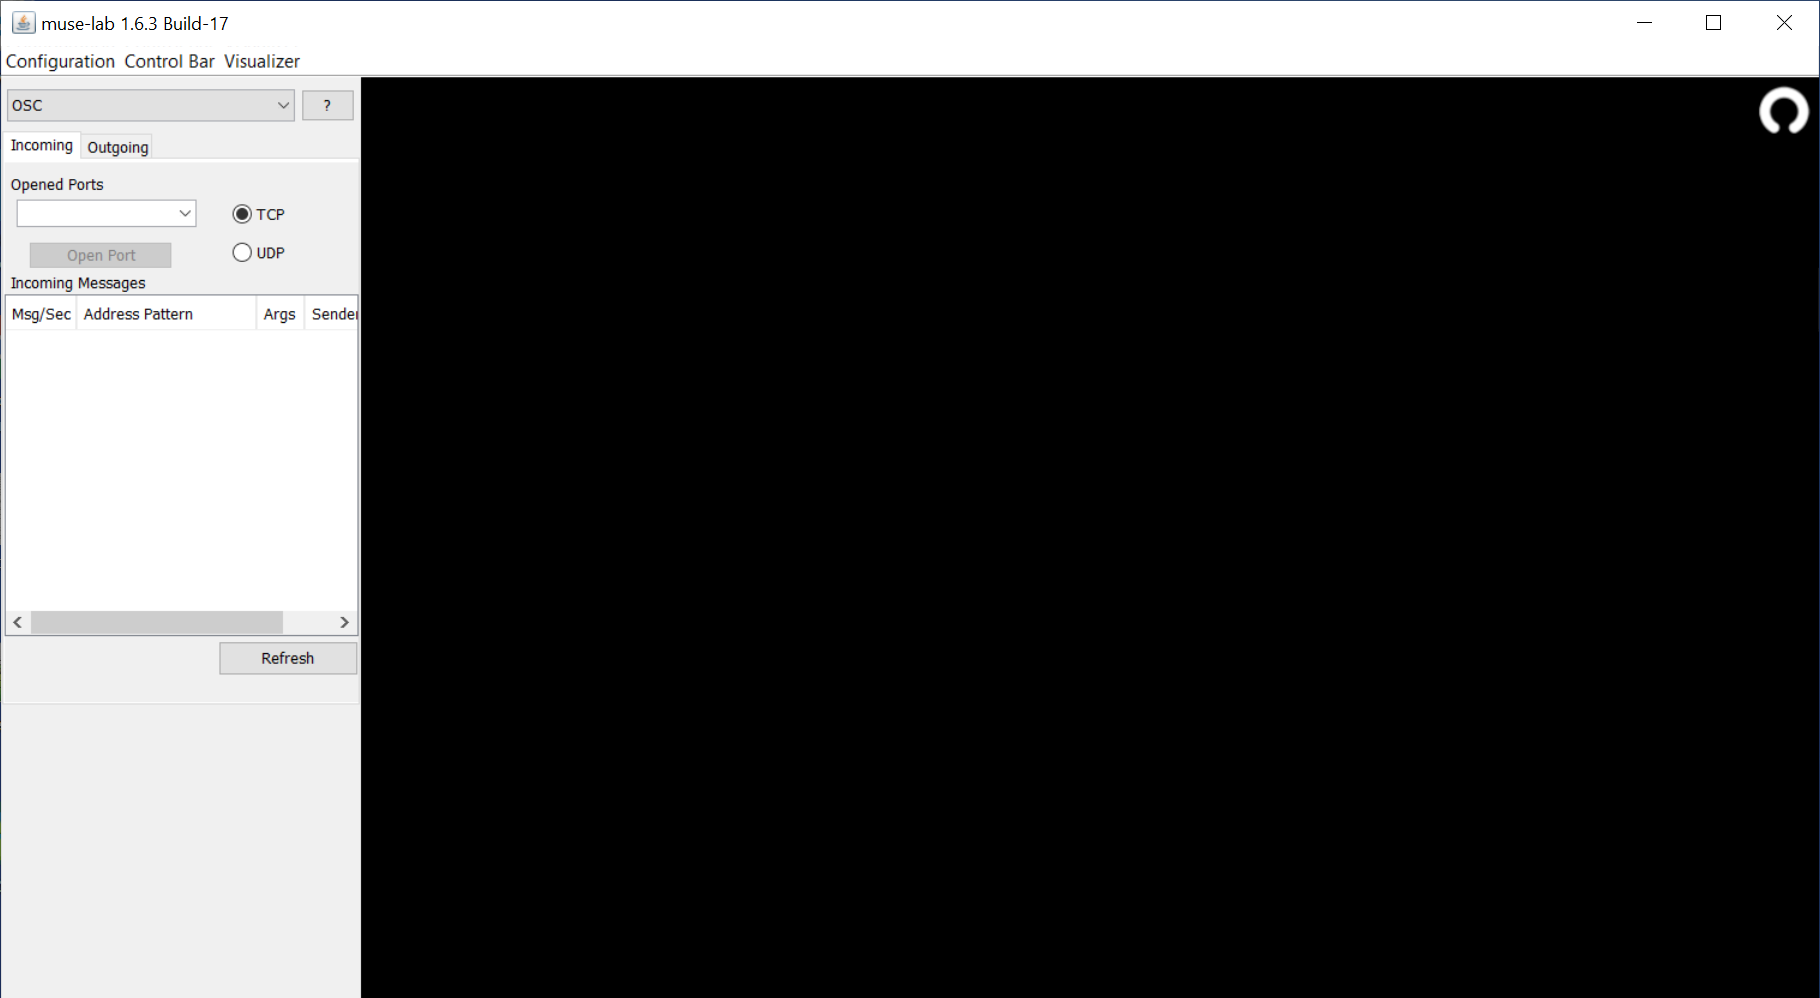
The black area is a signal graph. We didn’t connect the signal source yet, so there is nothing on display. To see the actual EEG data from the Muse device, we need two things.
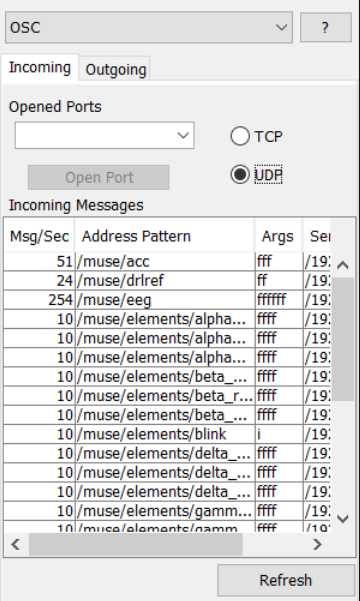
First, we need to connect to the stream to start receiving the data. The stream is on port number 8000 (or whatever value you used in Muse Direct settings) and uses UDP packets. Switch from TCP to UDP type the selected port number in the input box and click the Open button to open the connection. Assuming the Muse Direct application is streaming, the Incoming Messages table should start printing many messages if the connection is successful.
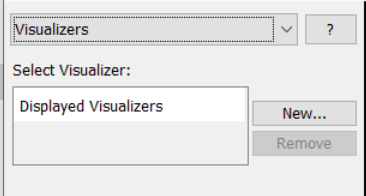
After the successful connection, the graph area is still black It turns out we need to configure a visualizer responsible for plotting the received data on the screen. In the menu list box, which currently points to OSC tab, we need to switch to Visualizers.
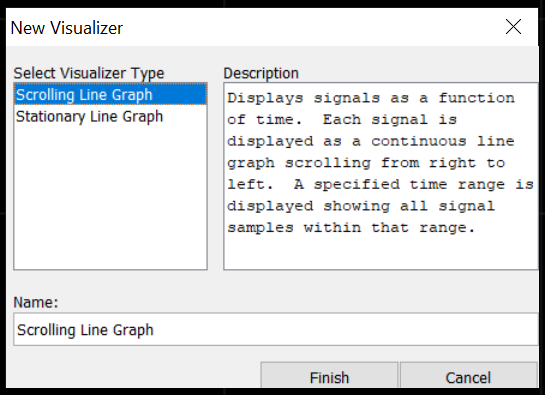
We need to create a new scrolling line graph, which plots the received samples in the time domain. I believe the other option is for frequency-domain graphs, although I did not test it.
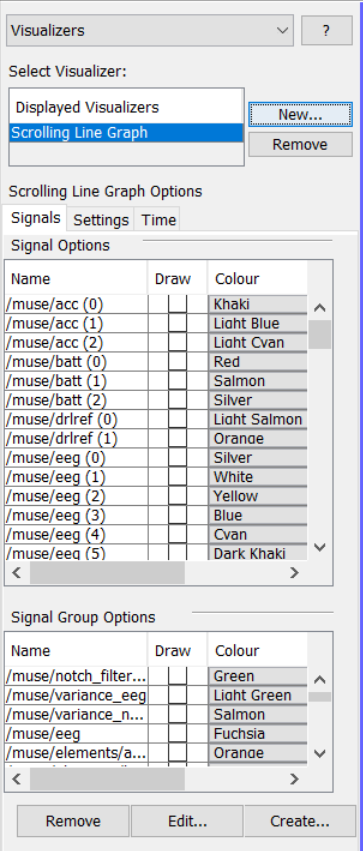
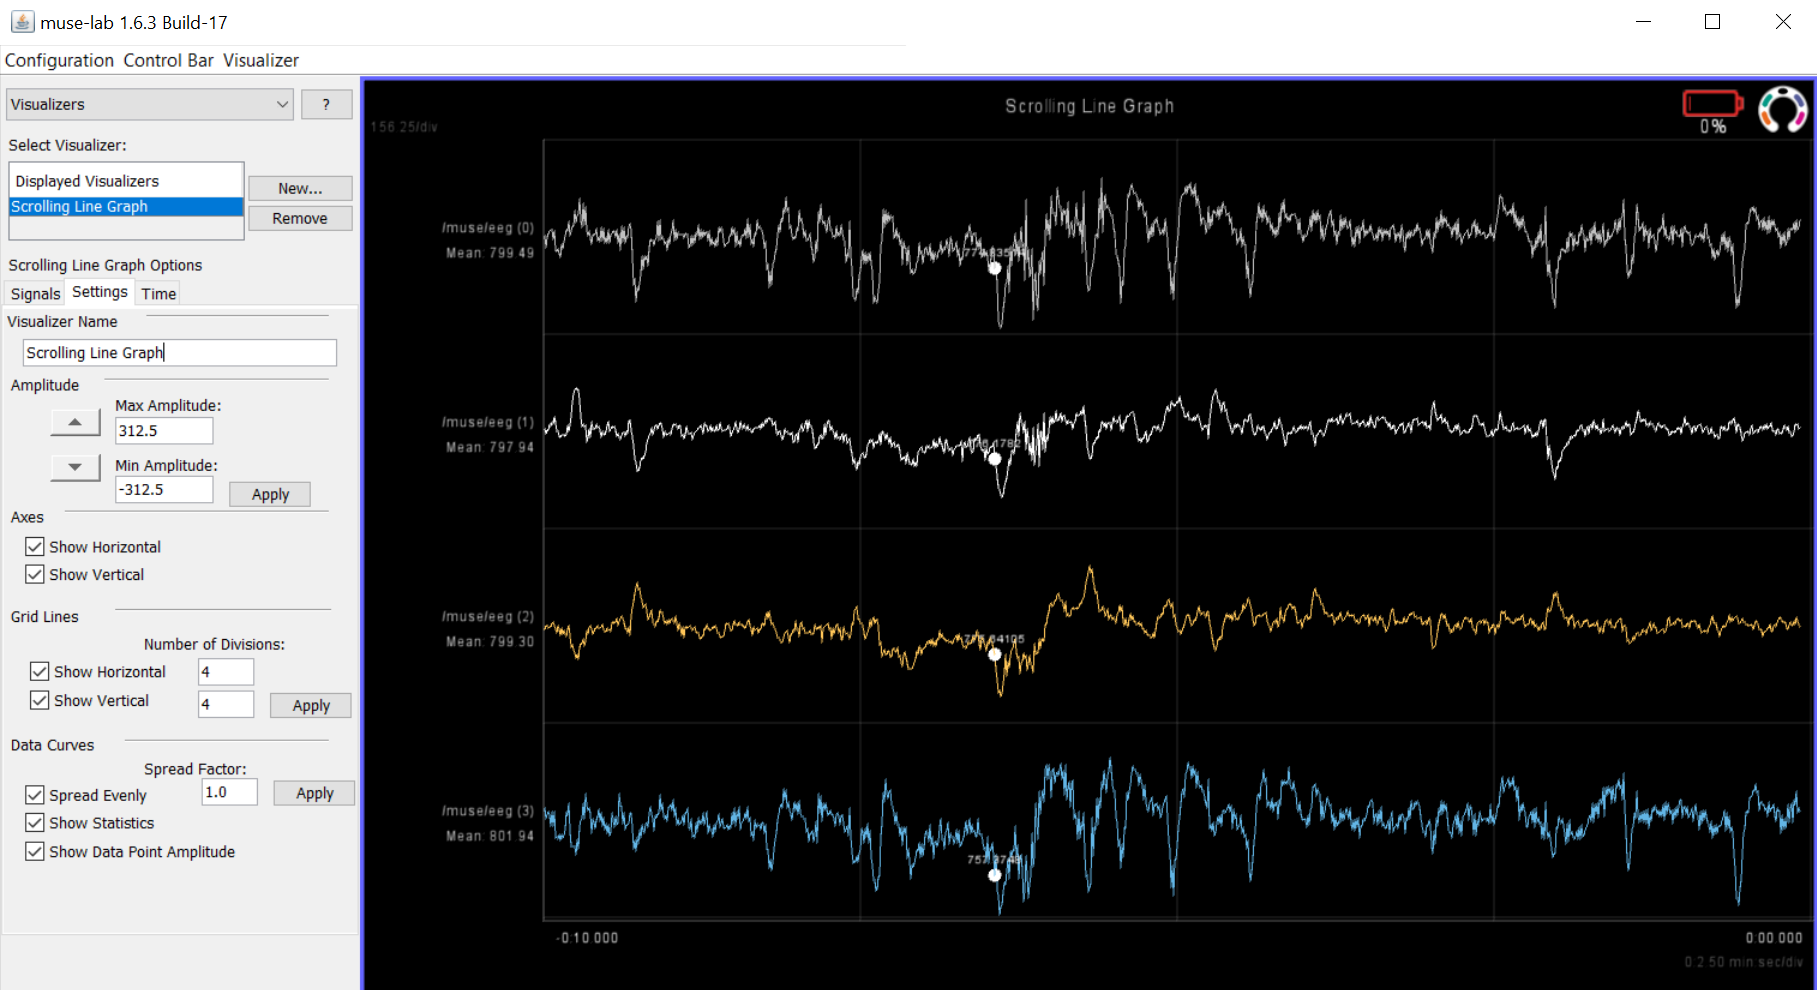
There are two options when it comes to data channel selection: Signal Options and Signal Group Options. The latter allows selecting multiple channels with one click. The one we are mostly interested in is /muse/eeg group. The headset has 4 EEG signal channels, while the /muse/eeg group has 6 of them. The last two are always zero, so we can disable them in the signal options table, by unchecking /muse/eeg (4) and /muse/eeg (5) checkboxes.
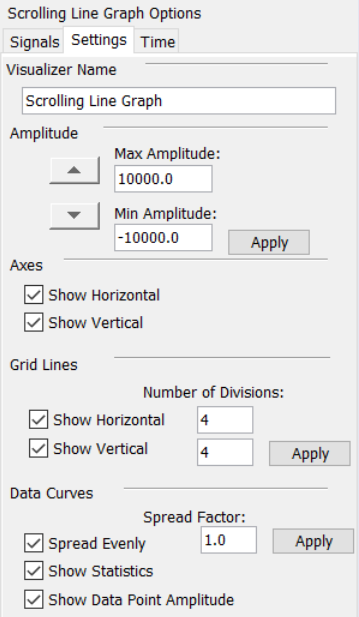
Finally, we should be able to see the data. The amplitude scale may require adjusting if the signal looks like straight lines. It can be done in the visualizer settings tab using the values of the min/max amplitude input boxes.
If everything went correctly we should see the EEG signal similar to the following screenshot.
We have successfully configured the EEG stream and connected to it with the Muse Lab app. Next time we are going to code a python script to receive and process the data from the stream. My current goal is to start coding actual BCI, like a mind-controlled version of a Pong game.